How to view summary of google forms responses?
"How Do I change the default colour of the Legend in Google form charts?"- Google Docs Editors Community
Google Forms' summary charts can't be restyled, and 238 people on Google's forum have asked how to change their colors. With many responses, the summary is where you see which option most people chose: Google Forms draws a pie chart, a bar chart or a list of answers for each question on its Responses tab. If your form is on your website with Formfacade, View in Google Forms on Formfacade's Responses tab opens that summary. For a chart of your own, sync the responses to Google Sheets and use Explore or a pivot table there.
Open your form in Formfacade and follow the steps below. If you don't have one yet, create your form first.
How to view the summary?
- Open your form in Formfacade and click on "Responses" tab

- If you see Submit to Google Forms, click it and click Proceed, so that responses from your form reach Google Forms. Only the responses submitted after that reach it.

- Click View in Google Forms. Your form's responses open in Google Forms

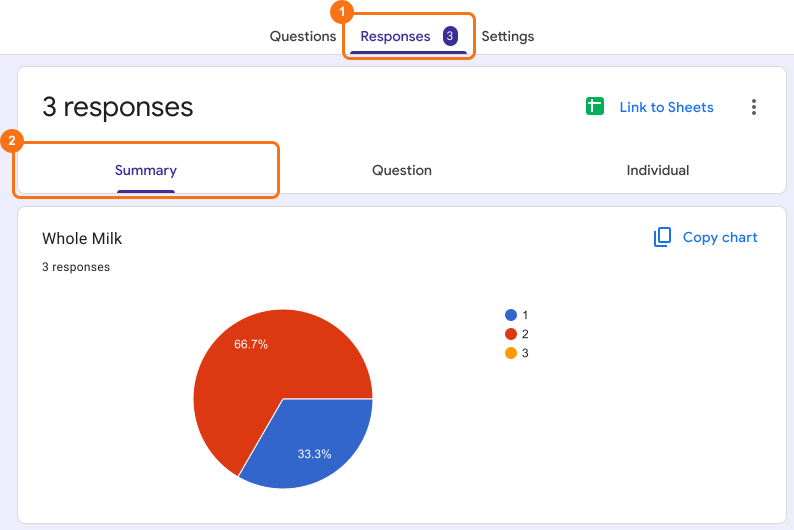
- Click Summary. Depending on the question type and the form responses, the summary is displayed as a pie chart, bar chart or just a list of answers.
⚠️ Important
If you want to analyze the form responses or create a custom summary / chart, you can sync your form responses to Google Sheets and use the explore or pivot table option in Sheets.
Summary
If you want the overall picture of your responses, counting answers by hand is slow. With Formfacade, you click Responses, View in Google Forms and Summary, and the answers show as a pie chart, bar chart or list, depending on the question type. Create your form and complete the steps above. If you have any questions, write to support.
Last updated: